Common Pitfalls in Data-Driven Decisions
Data-driven decisions often fail not due to a lack of data, but because of how data is used. Despite organisations investing billions in analytics, 85% of big data projects fail to meet their goals. Misleading metrics, confusing correlation with causation, and reliance on incomplete data are just a few of the challenges leaders face.
Key takeaways include:
- Metrics matter: Vanity metrics like app downloads or page views can misdirect focus. Instead, align KPIs with actionable outcomes, such as engagement ratios or conversions.
- Correlation ≠ causation: Misinterpreting relationships - like assuming advertising directly drives sales - can waste resources. Controlled trials or expert input can clarify causation.
- Data silos hinder decisions: Isolated datasets lead to fragmented insights. Sharing data across teams improves clarity and reduces duplication.
- Human judgement complements data: Algorithms lack context. Leaders must balance analytics with intuition, especially in uncertain situations.
- Data quality is critical: Poor-quality data costs organisations millions annually. Proactive governance and training can prevent errors and improve decision reliability.
Organisations should focus on "decision-driven analytics" - starting with clear questions and seeking data to address them. Leaders may wish to integrate data insights with human expertise to navigate complex decisions effectively.
Why Great Data Still Leads to Bad Decisions (And How to Fix It)
sbb-itb-ce676ec
Pitfall 1: Wrong Metrics and KPIs
Choosing the wrong metrics - often those that are easiest to measure - can misdirect strategy by prioritising flashy figures over actionable insights.
Spotting Misleading Metrics
Vanity metrics, which appear impressive but offer little practical value, can create a misleading sense of progress. Aurora Harley, Senior Information Architect at Nielsen Norman Group, explains:
"A telltale sign of a vanity metric is that the metric is ever growing, where bigger is always better".
Examples of such metrics include total app downloads, cumulative page views, and social media likes. These numbers tend to grow naturally over time but often fail to reflect meaningful performance or engagement.
In contrast, effective KPIs drive specific actions. For instance, instead of merely tracking total registered users, consider the stickiness ratio - daily active users (DAU) divided by monthly active users (MAU). A 10% DAU/MAU ratio indicates that one-tenth of monthly users log in daily, offering a clearer picture of user engagement. If this ratio drops, it signals the need for further analysis.
This approach aligns with the broader customer journey, ensuring metrics account for every stage, from initial discovery to final purchase. Jeff Larson, Associate Professor of Marketing at BYU Marriott, highlights this necessity:
"KPIs should line up with the steps of a customer journey, and the customer journey needs to be followed all the way to the end purchase - not just through the discovery stage".
Metrics like Facebook likes or retweets are of limited value unless paired with measures of how those interactions lead to conversions, such as purchases or other desired outcomes.
Recognising these challenges is essential, but the real work lies in ensuring metrics remain relevant and aligned with strategic goals.
Solution: Review Metrics Regularly
What worked six months ago may no longer serve today’s objectives. Regularly revisiting KPIs with interdisciplinary teams can help organisations stay on track. This practice also guards against the "Tyranny of Metrics", where employees may manipulate outcomes to meet targets. For example, healthcare providers might avoid high-risk patients to maintain favourable readmission statistics.
To improve clarity, transform raw numbers into ratios. For instance, instead of celebrating 50,000 video plays, examine the play rate over time or the ratio of plays to conversions. Using the shortest stable timeframe allows quicker, more targeted responses to changes in performance.
Pitfall 2: Mistaking Correlation for Causation
Building on the earlier discussion about misleading metrics, another frequent error in decision-making is confusing correlation with causation. Simply put, just because two variables move together doesn’t mean one is causing the other. Misinterpreting this relationship can lead to wasted resources and misguided strategies.
Common Misinterpretation Examples
A striking example comes from eBay in 2013. The company was spending around $50 million (approximately £40 million) annually on search engine advertising. At first glance, data showed a clear link between regions with more ads and higher sales. However, economists Tom Blake, Chris Nosko, and Steve Tadelis conducted a randomised controlled trial and discovered that the ads were mostly redundant. They were simply targeting customers who were already planning to shop on eBay.
Similarly, in 2015, a consulting report for Yelp suggested that businesses advertising on the platform earned more revenue than those that didn’t. To test whether advertising directly caused this success, Yelp's COO launched a large-scale experiment, offering free ad packages to thousands of randomly chosen businesses. The results showed that while advertising did have some positive impact, the original correlation was skewed. The underlying reason was that successful businesses were more inclined to invest in advertising in the first place.
These cases highlight three common traps: spurious correlations, where the relationship is coincidental; confounding variables, where an external factor influences both variables; and reverse causation, where the supposed "effect" might actually be causing the "cause". Nobel Laureate Daniel Kahneman aptly summarised this tendency with his observation:
"What you see is all there is".
Decision-makers often focus exclusively on visible data without questioning how it was generated or considering what factors might be missing.
Solution: Combine Data with Expert Knowledge
To establish causation, organisations should prioritise running randomised controlled trials (RCTs) with clearly defined treatment and control groups. Companies like Amazon and Booking.com have made such experiments a cornerstone of their decision-making processes.
When RCTs aren’t practical, consulting domain experts becomes essential. Experts can identify potential confounding factors and add qualitative insights that raw data might overlook. Before acting on a correlation, it's crucial to ask questions like: "What third factors - such as economic trends, weather patterns, or demographic shifts - might be influencing both variables?". Additionally, ensure that the supposed "cause" consistently occurs before the "effect" in your data.
Pitfall 3: Using Incomplete or Isolated Data
Relying on incomplete or isolated datasets can lead to flawed decision-making. When departments limit access to their data, leaders are left with a fragmented view of the organisation’s operations and challenges.
Problems with Isolated Data
Data silos force teams to rely on narrow, confirmatory insights, often ignoring broader external trends. As Professors Bart de Langhe and Stefano Puntoni note:
"Data-driven decision-making anchors on available data. This often leads decision makers to focus on the wrong question".
Instead of starting with the right questions, many organisations allow isolated data to dictate decisions. This approach not only distorts strategic priorities but also undermines trust within teams. Employees often waste time searching for, cleaning, and reconciling data - duplicating efforts and driving up operational costs.
Jonathan H. Westover, Chief Academic & Learning Officer at HCI Academy, highlights the danger of over-relying on single datasets:
"Leaders must exercise prudent scepticism of conclusions drawn from any single data set and complement numbers with diverse external perspectives".
The risks don’t stop there. Without robust systems, employees may resort to storing sensitive information in unsecured Excel files or personal cloud accounts, exposing organisations to compliance and security breaches.
Solution: Share Data Across Departments
To address these challenges, organisations need to break down data silos through both technological and cultural changes. Centralised data warehouses can consolidate structured data, while data lakes can handle unstructured information. Gartner forecasts that organisations effectively sharing information will outperform their peers on most business metrics.
Collaboration is key. Teams responsible for data platforms, security, and governance must work together. Implementing attribute-based access control (ABAC) can simplify policy management significantly, improving efficiency by as much as 93×. Additionally, forming interdisciplinary teams that bring together technical analysts and subject matter experts ensures that data is interpreted in context.
Regular external benchmarking can also help organisations identify biases in their internal data, offering a more balanced foundation for decision-making.
Pitfall 4: Ignoring Human Judgement and Context
Data offers a lens into past events but cannot predict future uncertainties. Leaders who fall into the trap of "dataism" - the belief that algorithms alone can reveal the truth - risk making decisions that might seem logical on paper but fail in practice. Martin Reeves, Mihnea Moldoveanu, and Adam Job caution against this mindset:
"It's naïve to believe that by gathering ever more data and feeding it to ever more powerful algorithms alone, businesses can uncover the truth, make the right decisions, and create value. We call this false belief 'dataism.'"
While data provides insights into historical trends, it lacks the contextual depth and foresight that human expertise brings. This expertise is essential for interpreting market shifts, anticipating external challenges, and understanding nuances that dashboards cannot capture. Over-reliance on internal metrics often blinds organisations to external changes, such as emerging competitors or shifting societal expectations.
Take, for instance, the divergent paths of Kodak and Fuji. Both companies had access to the same data about the rise of digital photography. Yet Kodak faltered while Fuji adapted and thrived. The difference lay not in the data itself but in how leadership interpreted and acted on it.
Leadership's Role in Decision-Making
Effective leadership requires balancing data with what psychologist Gerd Gigerenzer refers to as "tacit expertise" - the kind of intuitive pattern recognition that comes from experience. This isn’t about pitting intuition against data; it’s about understanding that intuition is a form of intelligence, particularly valuable in high-stakes, ambiguous situations where perfect information is unavailable.
Laura Huang, Associate Professor at Harvard Business School, highlights the importance of this balance:
"The role of gut feel is often to inspire a leader to make a call, particularly when the decision is risky"
When intuition and data seem to conflict, leaders must step back, manage their emotions, and ensure their decisions remain balanced and objective.
Additionally, leaders benefit from practising what Toyota terms genchi genbutsu, or "go and see for yourself." Just as pilots hone their skills through manual flying, leaders should engage directly with stakeholders and environments to stay grounded in reality, rather than relying solely on dashboards or reports.
Incorporating multiple perspectives is critical for well-rounded decision-making.
Solution: Include Multiple Perspectives
Organisations should move beyond "data-driven" approaches to adopt "decision-driven analytics" - starting with the right questions and then identifying the data needed to address them. This method requires collaboration between technical analysts and subject matter experts who can interpret the broader implications of decisions, including their human and societal dimensions.
Interestingly, 67% of CEOs report relying on intuition over analytics when making high-stakes decisions. The goal, therefore, isn’t to choose between data and judgement but to integrate the two. This approach directly counters the risks associated with "dataism" by ensuring decisions are informed by both evidence and context.
House of Birch’s leadership advisory services support high-stakes decision-makers by helping them develop emotional discipline and strategic intelligence. Through tailored coaching, leaders learn to discern when data provides clarity and when human insight must bridge the gaps. This integrated approach ensures decisions not only align with data but also reflect situational demands, including organisational culture, employee morale, and external realities.
Pitfall 5: Poor Data Quality and Implementation
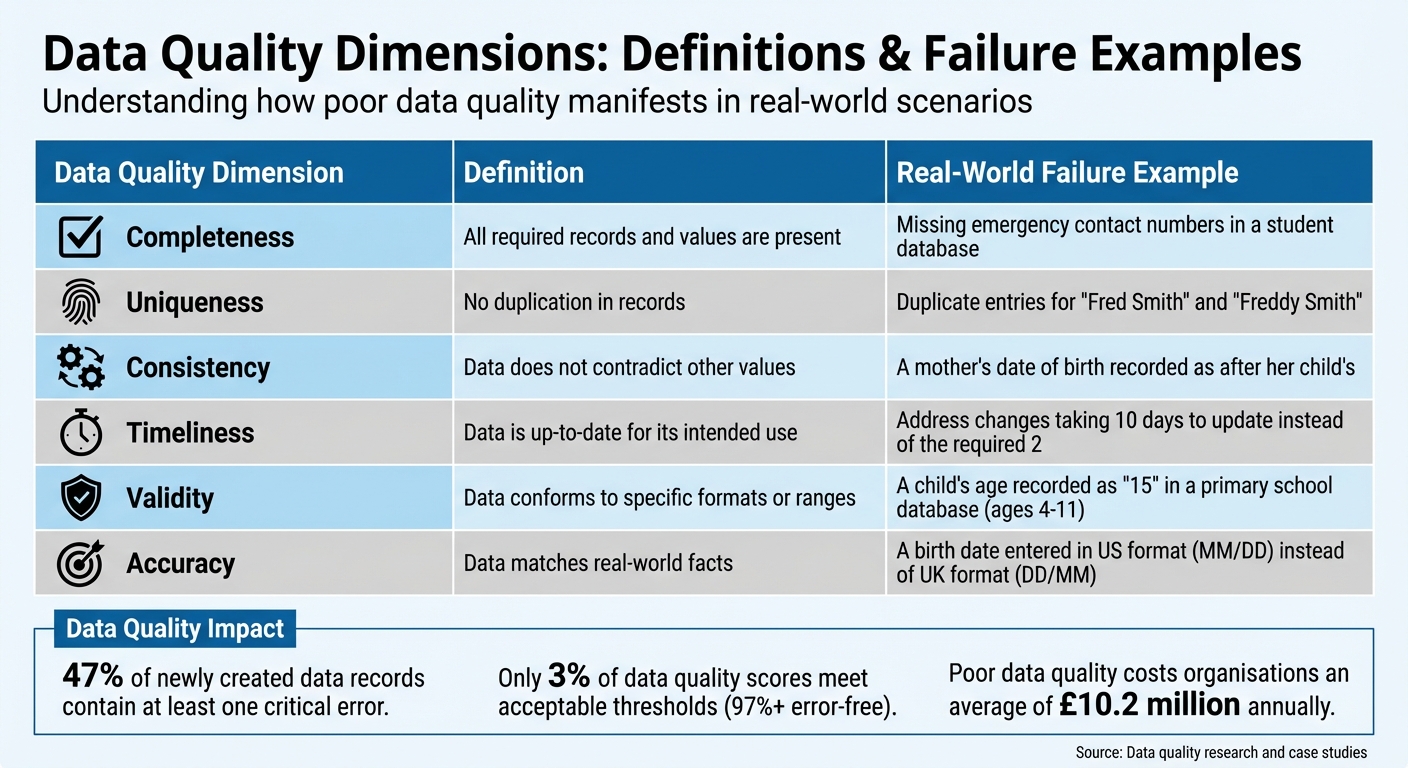
Data Quality Dimensions: Definitions and Real-World Failure Examples
Even the most advanced analytical tools are only as good as the data they rely on. Poor data quality can undermine the effectiveness of any data-driven decision-making framework. Statistics reveal the scale of the problem: 47% of newly created data records contain at least one critical error, while only 3% of data quality scores meet the "acceptable" threshold (defined as 97% or more error-free). The financial toll is substantial, with poor data quality costing organisations an average of £10.2 million annually. Additionally, 88% of data integration projects either fail outright or exceed their budgets, largely due to data quality issues.
Finding Data Quality Gaps
The root causes of poor data quality often lie in how organisations are structured. Unclear ownership of data allows errors to persist, while siloed operations create barriers to sharing consistent data standards. These challenges are compounded by manual processes, which increase the likelihood of human error and inflate costs.
Many organisations operate in a reactive "cleanup mode", addressing errors only after they've caused problems. As Matt Harrison Clough from MIT Sloan Management Review notes:
"Poor-quality data can cripple decision-making and doom generative AI projects, since bad data fed to AI models turns into untrustworthy results".
In contrast, high-performing organisations focus on preventing errors at their source, a proactive approach that has proven far more effective.
Consider the tragic case of the Irish Coast Guard in March 2017. A search and rescue helicopter, Rescue 116, crashed into Black Rock Island, resulting in the loss of four crew members. The preliminary investigation found that the island was missing from the database of the helicopter's Enhanced Ground Proximity Warning System. This data quality failure directly contributed to the disaster, demonstrating that the consequences of poor data quality can extend far beyond financial losses.
Data scientists spend about 60% of their time cleaning and verifying data. Without a clear understanding of how data flows through systems, many organisations struggle to pinpoint where errors originate. The result is unreliable information being used to make decisions, often with serious consequences.
Solution: Improve Governance and Training
To address these challenges, organisations must prioritise proactive data governance and robust training programmes. Effective data management is not just an IT issue; it requires a cultural shift where every employee recognises their role as both a data creator and a data user. For example, HelloFresh successfully transitioned from reactive fixes to a proactive approach by training employees to prevent errors at the source. This shift has enabled more reliable analytics to support decision-making.
A strong governance framework starts with clearly defined roles. Assigning responsibilities using a RACI matrix (Responsible, Accountable, Consulted, Informed) can eliminate confusion. Typical roles include:
- Data Owners: Senior leaders accountable for specific data assets.
- Data Stewards: Business experts who manage day-to-day data quality.
- Data Custodians: Technical managers responsible for safeguarding data.
The following table outlines key dimensions of data quality, their definitions, and real-world examples of failures:
| Data Quality Dimension | Definition | Failure Example |
|---|---|---|
| Completeness | All required records and values are present | Missing emergency contact numbers in a student database |
| Uniqueness | No duplication in records | Duplicate entries for "Fred Smith" and "Freddy Smith" |
| Consistency | Data does not contradict other values | A mother's date of birth recorded as after her child's |
| Timeliness | Data is up-to-date for its intended use | Address changes taking 10 days to update instead of the required 2 |
| Validity | Data conforms to specific formats or ranges | A child's age recorded as "15" in a primary school database (ages 4-11) |
| Accuracy | Data matches real-world facts | A birth date entered in US format (MM/DD) instead of UK format (DD/MM) |
Training should be tailored to the data literacy needs of each role. Using real datasets from ongoing projects as case studies can make training more engaging and practical. Automation also plays a critical role in maintaining data quality, with automated checks helping to detect inconsistencies and "data drift" early. Establishing feedback loops allows end-users to report inaccuracies, fostering a collective sense of responsibility for data integrity.
Rather than striving for unattainable perfection, organisations should aim for "fitness for purpose" - ensuring data meets the needs of its intended use. Conducting root cause analysis to address errors at their source can transform data governance from a compliance task into a strategic capability, much like HR or Finance. This shift enables leaders to make confident, well-informed decisions based on reliable data.
Strong data quality practices are essential for maintaining actionable insights and ensuring that decisions are both informed and contextually appropriate. Leaders navigating complex environments may benefit from bespoke advisory services, such as those offered by House of Birch, which integrate data governance principles into strategic frameworks. These services help organisations build decision-making processes grounded in reliability while remaining adaptable to their unique challenges.
Building Balanced Decision-Making Frameworks
Tackling the challenges of decision-making requires a framework that blends data insights with human judgement.
Successful leaders know how to combine data with intuition. Research shows that data-driven organisations improve decision-making threefold, while 81% of highly intuitive CEOs managed to double their businesses within five years, compared to just 25% of less intuitive peers.
The process begins with a clear vision to set direction, followed by using intuition to form hypotheses, and then applying data to test and adjust these ideas. Netflix CEO Reed Hastings refers to this as "informed intuition":
"We start with the data. But the final call is always gut. It's informed intuition."
This approach acknowledges that while data is essential for optimising current operations, vision is what aligns decisions with long-term goals. When conflicts arise between data and intuition, naming the emotions involved - such as anxiety or frustration - can help create the necessary emotional distance to evaluate the situation more clearly.
Effective teams rely on both quantitative analysts and subject matter experts to interpret data comprehensively. For instance, Google's Project Oxygen initiative in 2013 reviewed over 10,000 performance evaluations, focusing on qualitative feedback rather than just numbers. This led to an improvement in managers' median favourability scores from 83% to 88%.
The Role of Bespoke Leadership Advisory
Leaders in high-stakes situations often encounter incomplete or contradictory data. In such cases, external advisory services become invaluable. House of Birch offers tailored leadership advisory services aimed at helping leaders navigate the "human layer" of decision-making. Their focus includes enhancing what psychologist Gerd Gigerenzer calls "unconscious intelligence" - the pattern recognition skills that leaders develop through years of experience, which are especially critical in uncertain scenarios.
These advisory services help leaders go beyond the binary choice of data versus intuition, promoting a decision-making culture where both are seen as complementary. This includes identifying when KPIs may misrepresent true performance, encouraging rigorous discussions to validate data findings, and acting as "informed contrarians" to challenge biases and assumptions. With 2.5 quintillion bytes of data being generated daily, the challenge isn't the volume of information but the ability to extract actionable insights.
By adopting this balanced approach, organisations can avoid the pitfalls of misleading metrics, isolated data, and over-dependence on analytics.
Comparison of Data-Driven Risks and Balanced Solutions
The table below highlights the risks of relying solely on data and the benefits of a more balanced approach.
| Risk of Data-Only Approach | Balanced Solution |
|---|---|
| Tyranny of Metrics: KPIs distort behaviour (e.g. physicians avoiding high-risk patients to meet readmission targets). | Contextual Monitoring: Combine metrics with human insight and watch for unintended consequences. |
| Data Tunnel Vision: Focusing solely on internal data overlooks market shifts and emerging competitors. | External Benchmarking: Compare internal data with industry trends and external perspectives. |
| Correlation vs. Causation: Misinterpreting statistical patterns as direct cause-and-effect. | Expert Vetting: Involve subject matter experts to validate statistical findings with context. |
| Algorithmic Bias: Over-reliance on AI can dismiss top talent due to unconventional profiles. | Human Synthesis: Combine quantitative data with qualitative insights, such as interviews and intuition. |
A balanced decision-making framework also requires psychological safety - an environment where team members feel confident sharing instincts that may challenge existing data. As Malcolm Gladwell puts it:
"Truly successful decision-making relies on a balance between deliberate and instinctive thinking."
This equilibrium transforms data into a strategic advantage, enabling leaders to make well-informed decisions that account for both human complexity and shifting market dynamics.
Conclusion
Data-driven decision-making can be powerful, but only when leaders acknowledge its limitations. The five pitfalls discussed - misleading metrics, confusing correlation with causation, relying on isolated data, neglecting human judgement, and poor data quality - arise when organisations treat data as the definitive answer rather than as one piece of the puzzle. While data-driven organisations are three times more likely to report substantial improvements in decision-making, this benefit diminishes without the integration of context, expert insight, and intuition.
To address these challenges, leaders must approach data with a sense of purpose. Transitioning from being data-driven to decision-driven is crucial. This means starting with a specific problem and gathering data tailored to solving it. Professors Bart de Langhe and Stefano Puntoni emphasise this shift:
"Instead of finding a purpose for data, find data for a purpose. We call this approach decision‐driven data analytics".
Leadership often relies on intuition, which psychologist Gerd Gigerenzer describes as an unconscious intelligence refined through experience. This instinct enables leaders to sift through vast amounts of data and make sound decisions. When intuition and data appear to conflict, identifying emotions like frustration or anxiety can provide the clarity needed for objective analysis.
Effective leaders create systems that blend analytical precision with intuitive judgement. They validate their data's reliability, encourage cross-disciplinary discussions to challenge assumptions, and foster an environment where team members feel safe voicing concerns. As Marc Dotson puts it:
"Data is not making the decision for you; it's just informing you so you can make the right decision".
In high-pressure situations where decisions carry significant weight, balancing detailed analysis with informed judgement is non-negotiable. Leaders who strike this balance turn data from a potential liability into a strategic advantage. For those looking to refine this approach, House of Birch offers tailored leadership advisory services that combine data insights with seasoned intuition.
FAQs
How do I choose KPIs that actually drive action?
To ensure KPIs effectively drive action, they should align closely with your organisation’s strategic goals and provide clear, actionable insights. Choose metrics that directly impact behaviour and inform decision-making, steering clear of excessive or irrelevant data points that may dilute focus. In fast-changing environments, it’s crucial to regularly evaluate and adjust KPIs to maintain their relevance, ensuring they continue to support objectives such as growth, operational efficiency, or risk mitigation.
How can we prove causation without running an RCT?
Causation can still be established without relying on randomised controlled trials (RCTs) by employing alternative methods such as quasi-experiments, observational data analysis, and causal inference frameworks. Techniques like directed acyclic graphs, potential outcomes, and structural equations play a key role in estimating causal effects while accounting for confounding variables. These approaches offer valuable insights, particularly in situations where conducting RCTs is either impractical or impossible.
What’s the fastest way to break down data silos safely?
To dismantle data silos effectively and securely, organisations should reconsider how information moves between their systems. Implementing unified data pipelines and leveraging integration tools can bridge disconnected platforms. By focusing on data security and consistency, teams can collaborate efficiently without risking the integrity or confidentiality of sensitive data.
